Asked by
Shaneik Minott
on Oct 24, 2024
Verified
Malaria is a leading cause of infectious disease and death worldwide.The table below represents the mean number of reported malaria cases (between 1996 and 2006) for each of 10 West African countries,as published in the journal Statistica Neerlandica in 2010. 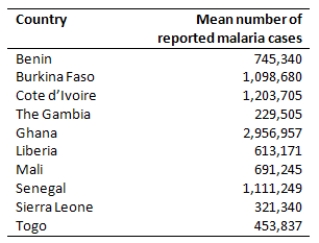 Why is it not appropriate to use a histogram to display these data?
A) A pie chart is much easier to read.
B) The data are categorical and therefore a histogram is not appropriate.
C) The width of the bins would be too large to display a histogram.
D) None of the above
Histogram
A graphical representation of the distribution of numerical data, typically showing the frequency of data within specified intervals.
Statistica Neerlandica
A peer-reviewed scientific journal covering research in all areas of statistics.
- Contrast categorical versus quantitative data variables.
- Ascertain the correct methods for illustrating diverse data forms.

Verified Answer
JS

Learning Objectives
- Contrast categorical versus quantitative data variables.
- Ascertain the correct methods for illustrating diverse data forms.